
According to The Governance Report 2016’s findings, increased infrastructure spending does not necessarily translate into improved infrastructure outcomes. The Governance Report is an annual series published by Oxford University Press and deals with recent public policy questions, like ‘infrastructure governance’ in its 2016 edition.
Each year, The Governance Report team develops sets of governance indicators. For the 2016 edition these indicators were designed to measure how well countries manage their infrastructure investments. Moreover, a Global Expert Survey on Public Infrastructure was conducted, providing some of the variables used to build the indicators. This article presents some of The Governance Report 2016’s main findings.
There appears to be a general consensus nowadays that increased infrastructure spending can boost job creation and economic recovery worldwide. McKinsey (2015) calculates that at least $57 trillion will be needed before 2030 in order to build the infrastructure that the global economy needs so badly. Similarly, Standard & Poor’s (2015) emphasizes the “multiplier effect” of an increase in infrastructure spending of 1% of real GDP. In this sense, in a three-year period, while such an increased investment is expected to increment GDP by 1.2% in Germany, the predicted increase would be 1.4% in the Eurozone as a whole (generating 157,000 and 627,000 new jobs, respectively). This “multiplier effect” is even higher in developing countries such as Brazil and China (2.5 and 2.2, respectively).
In line with these recommendations, the German government has launched a 15-year plan to spend a total of €263 billion on roads, railways and waterways. Similarly on the European level, the Juncker Investment Plan has been launched by the European Commission, aiming at mobilizing investments of at least €315 billion in only three years without adding to public debt or straining national budgets any further. Moreover, according to McKinsey (2015), while developed countries such as the United States, United Kingdom and Canada suffer from an infrastructure investment gap of around 1 % of their respective GDPs, developing countries such as Brazil, Mexico, Indonesia and India need nearly an additional 3% of their GDP spent on infrastructure.
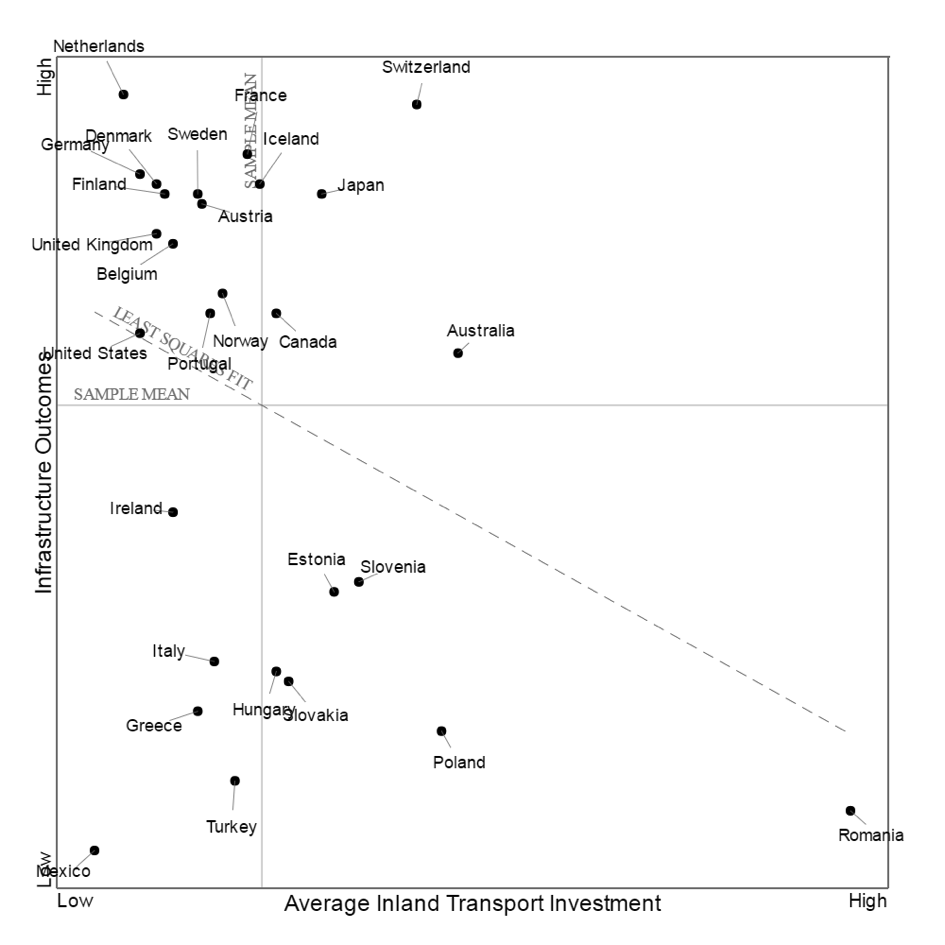
In spite of all this, The Governance Report 2016 finds that there seems to be a negative relationship between spending on infrastructure and infrastructure outcomes such as quality and productivity. As a matter of fact, a country such as Romania, although it invests more than 2.76 percent of its GDP in public infrastructure, it has one of the weakest performances on the infrastructure outcomes measure, which is one of the three dimensions that constitute the infrastructure governance index. At the same time, countries such as the Netherlands, Iceland and Germany spend much less on their infrastructure and still achieve some of the highest infrastructure outcomes scores. This negative association between spending and infrastructure outcomes is shown in Graph 1, examining the relationship between average inland transport investment, measured as a percentage of GDP, and each country’s performance on the infrastructure outcomes dimension of The Governance Report 2016’s indicator set. It is also important to note that the infrastructure governance index is a new indicator developed for The Governance Report 2016, encompassing what are considered to be the three main dimensions of infrastructure governance (planning, management and outcomes). The Governance Report Team made use of a novel statistical approach known as Bayesian factor analysis (BFA) for its development, considering both infrastructure governance and its three dimensions to be latent concepts whose direct measurement is impossible.
Graph 1. Component Relationship. Average Inland Transport Investment and Infrastructure Outcomes
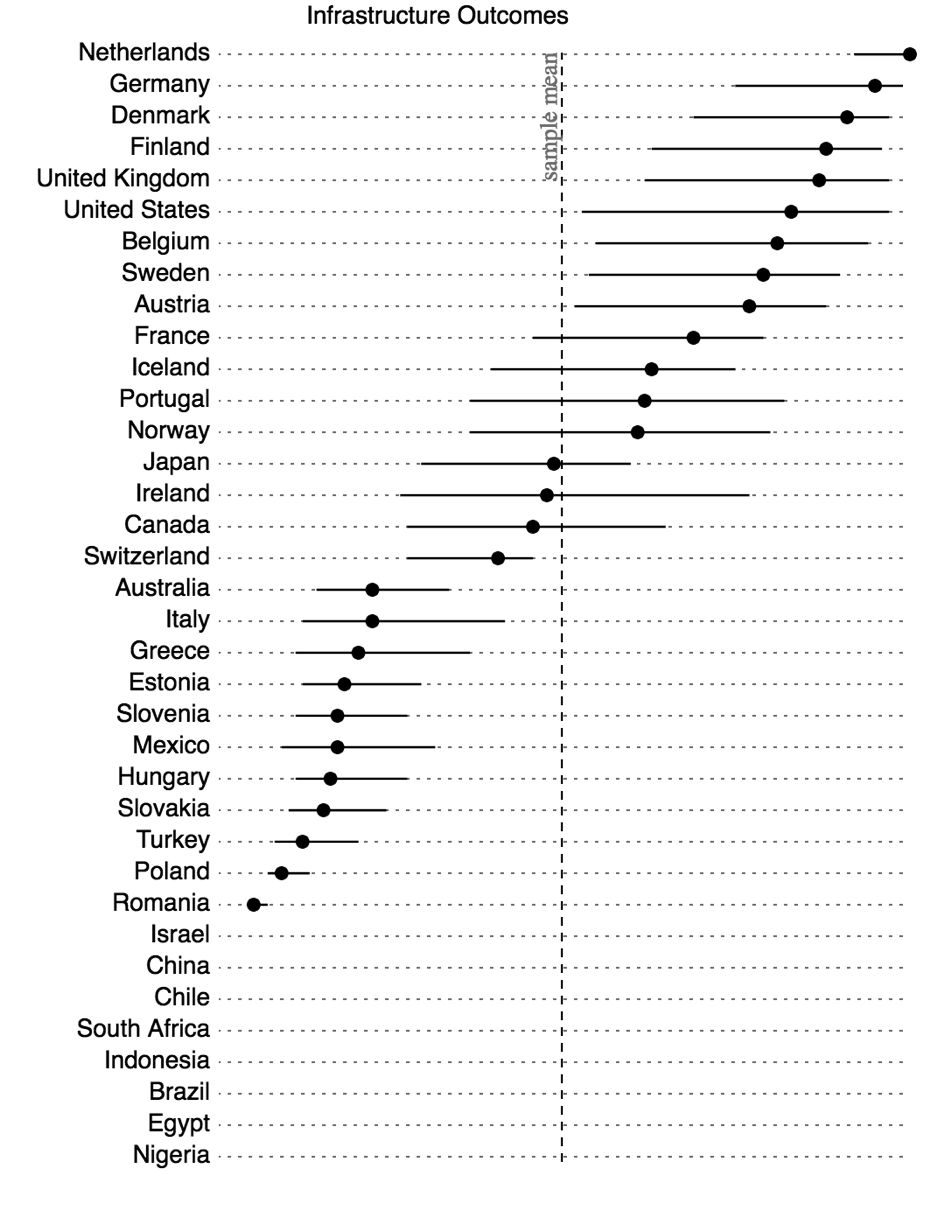
Furthermore, Graph 2 shows how countries rank when comparing their performances on the various infrastructure indices. In the case of the infrastructure outcomes dimension, once scaled by level of investment, the conclusions that can be drawn from the country ranking are in line with those of Graph 1. In this sense, while countries such as the Netherlands, Germany, Denmark, Finland and the United Kingdom are the best performers, others such as Romania, Poland, Turkey, Slovakia and Hungary obtain the lowest scores. With regard to the average performers, countries such as Japan, Ireland and Canada receive the closest scores to the sample mean.
Graph 2. Country Ranking. Infrastructure Outcomes
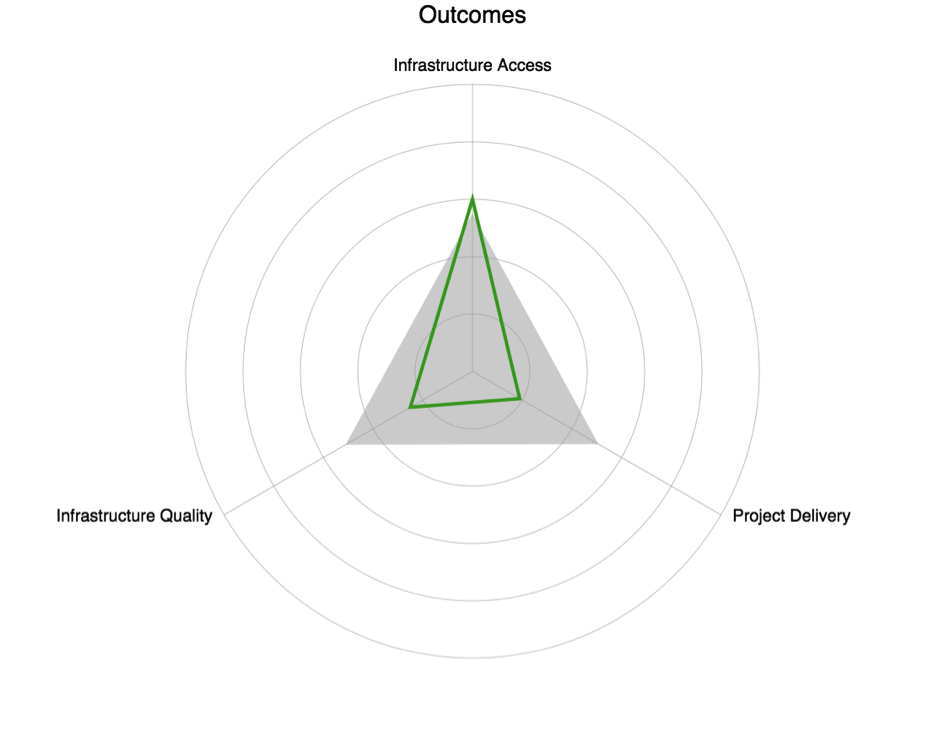
When focusing on Romania, the worst performer on the infrastructure outcomes index, the radial component comparison tool in Graph 3, shows us how it performed on all the underlying components that constitute the outcomes dimension, as well as how its performance compares to another country or country group. Thus, although Romania outperforms the average scorer in terms of infrastructure access, its performance is much worse when it comes to infrastructure quality and project delivery.
Graph 3. Component Comparisons. Infrastructure Outcomes. Romania
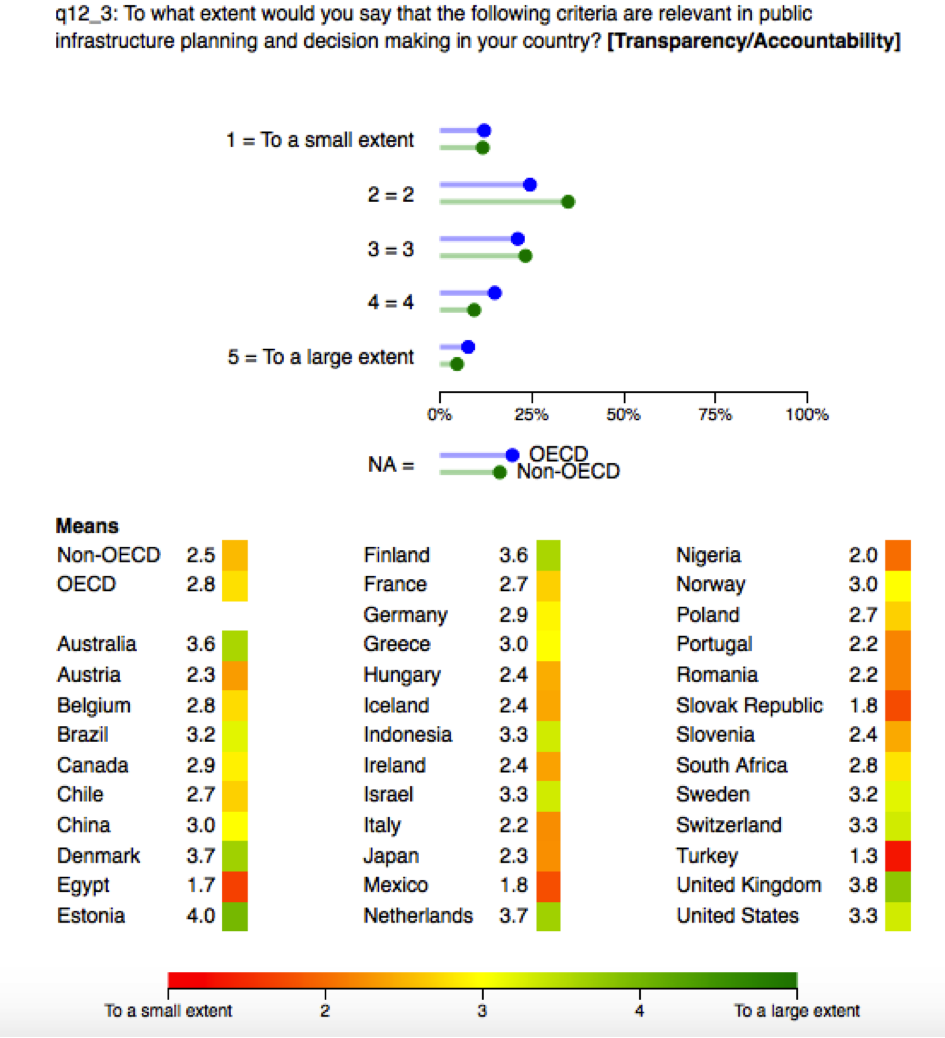
 Concerning the aforementioned Hertie School-OECD Global Expert Survey on Public Infrastructure, which contains expert survey data from 36 countries, it gives countries scores ranging from 1 to 5, 5 being the largest extent to which a condition is fulfilled. In the case of the extent to which transparency and accountability are relevant criteria in public infrastructure planning and decision-making in a given country, while the mean for non-OECD countries is 2.5, OECD countries score a mean of 2.8 points in the 1-5 scale. For instance, industrialized nations such as the United States, the United Kingdom, Australia, the Netherlands, Denmark and Finland are the best performers, obtaining scores well beyond 3. In opposition to this, other developed countries such as Germany, France and Japan receive scores lower than 3. On the other hand, with regard to the worst performers, those being Egypt, Mexico, Slovak Republic and Turkey, all of them scoring well below 2. Related to this, The Governance Report 2016 points to the fact that transparency of decision-making processes may be the key element explaining divergent countries’ performances on the infrastructure outcomes dimension. Graph 4 shows the Hertie School – OECD Global Expert Survey results regarding the relevance of transparency and accountability in infrastructure decisions.
Graph 4. Global Expert Survey. Transparency/Accountability as Relevant criteria in decision making
In conclusion, although increased infrastructure spending may be one way to kick off economic growth, there does not appear to be a causal relationship between higher level of infrastructure spending and better infrastructure outcomes such as quality and productivity. Strengthening infrastructure management capacities, and especially transparency mechanisms, seems to be fundamental in order for governments to change this. In times of economic crisis and austerity politics, citizens may not be willing to put up with political leaders whose infrastructure investment decisions do not translate into improved outcomes.

Diego Fernández Fernández is an MPP Graduate from the Hertie School of Governance and currently works as a Research Associate at The Governance Report. Previously, he did a BA in Journalism (USC, Spain) and an MA in International Relations (IBEI, Spain). During his studies at Hertie, he also interned at the GIZ office in Costa Rica. He is passionate about European politics, international development, as well as corruption studies.
Further relationships can be explored by using the online interactive tools or downloading the full dataset for the 2016 Governance Indicators: http://www.governancereport.org/home/governance-indicators/2016-governance-indicators/